 One of the two most important attributes of effective leaders is their ability to predict. (The other is delegating.)
One of the issues discussed in Scrum: The Art of Doing Twice the Work in Half the Time by Jeff Sutherland, is the failure of most projects to be completed within the expected timeframe. In the customer service arena it’s two headed monster. Often by the time the project is completed the customer’s needs and desires have changed. The target moves. Not only is the completion date missed, the scope of the project changes, extending the project further, or losing it all together.
If you’re a leader and you continually fail to have your team meet their expected time frames and the outcome expected on projects,  you’re failing at one of the most critical leadership attributes. And you probably won’t be in a position of leadership for long!
Utilizing Scrum solves your ability to predict accurately.
How do you currently predict when projects and a priority are completed?
If you’re having trouble navigating in this area of your business consider using Scrum. (Download IMPLEMENTING SCRUM—HOW TO BEGIN)
In the book Sutherland discusses one predictor that you shouldn’t be using.
Gantt Charts – Don’t Chase Waterfalls
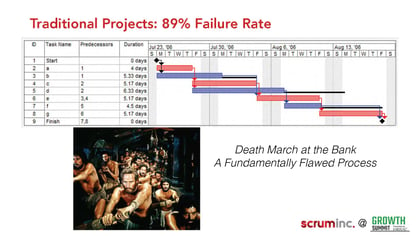
In 1993 when Sutherland worked at Easel as VP of Object Technology, he was asked to develop a completely new product line in six months aimed at their biggest customer Ford Motor Company. Easel was using Gantt Charts and the waterfall method.
Here’s how Sutherland describes what happened: That old methodology was the Waterfall method I described in the last chapter: everything related to a project carefully laid out on those massive Gantt charts, every task measured out precisely in hours highlighted in pretty colors flowing down the page like a waterfall. Those charts were beautiful in their precision. They were also complete fabrications. At Easel, I knew the Waterfall methodology would put us months if not years past our deadline. We had to come up with a completely different way of doing things. I went to the CEO and told him we were scrapping the Gantt chart. He was shocked and demanded to know why. “How many Gantt charts have you seen in your career?” I asked. “Hundreds,” he replied. “How many of them were right?” He paused. “None.” That’s when I told him I was going to give him working software at the end of the month instead of a broken Gantt chart. He could try it out for himself and see if we were on track. We had to try it, if we were going to meet our deadline.
Gantt charts are named after Henry Gantt, who developed them. The advent of personal computers in the 1980s made it easy to create these intricate charts—and to make them really complex— so much so they have become works of art. Every single step in a project is laid out in detail. Every milestone. Every delivery date. The charts are truly impressive to behold. The only problem is - they are always, always wrong.
This is Sutherland’s comical observation: Henry Gantt invented his famous charts around 1910. They were first used in World War I by General William Crozier, who was the Chief of Ordnance for the US Army. Anyone who has studied that war knows that efficient organizational capability was not exactly a salient feature. Why a World War I artifact has become the de facto tool used in twenty-first-century project management has never been quite clear to me. We gave up on trench warfare, but somehow the ideas that organized it are still popular.
It’s just so tempting: all the work needed to be done on a massive project laid out for everyone to see. Many companies have people whose only job is to update that Gantt chart every day. The trouble is, once that beautifully elegant plan meets reality, it falls apart. But instead of scrapping the plan, or the way they think about the plan, managers instead hire people to make it look as if the plan is working. Essentially, they’re paying people to lie to them.
Prediction?
 How’s your ability to predict? What’s your track record forecasting revenue growth, profit, loss and the overall economic condition of your business?
When we work with customers we don’t expect every milestone and priority a company chooses in their quarterly and annual plan to be achieved. At the same time a majority of them should be!
If you’re not achieving success something is wrong with your leadership team.
A healthy track record is 75% achievement of your success criteria each quarter.
Is your track record that good? Do you even know what your track record is? How many of your leadership team consistently meet or exceed their quarterly objectives 75% or more? That barometer should also give you an indicator on how well your front line team members meet their individual priorities/objectives.
Can you answer this question: “Do the people in your company know how well they’ve done before they go home every night? People perform what they measure – help the performers to measure the “right” stuff. ~ Ralph C. Stayer & James Belasco, Flight of the Buffalo
The lesson here isn’t just don’t use Gantt Charts and use Scrum. It’s measuring what you want your people and your company to produce. It’s recognizing the enormous power of Pearson’s Law.
Next Blog
Sutherland’s often stated premise in Scrum: The Art of Doing Twice the Work in Half the Time is Change or Die. Next blog Change or Die Part II we examine why most companies invest time in minutia, tactical efforts that fail to provide traction. Scrum and The ONE Thing: The Surprisingly Simple Truth Behind Extraordinary Results by Gary Keller, Jay Papasan are intrinsically interwoven. One Thing implies a priority focus and Scrum works on the premise you must be singularly focused. It’s why Scrum and the One Thing agree on the lie of Multi-tasking. Join us as we share examples of businesses that refuse to act strategically and the risk that results.


.jpeg?width=150&height=135&name=Hand%20with%20marker%20writing%20the%20question%20Whats%20Next_%20(1).jpeg)

