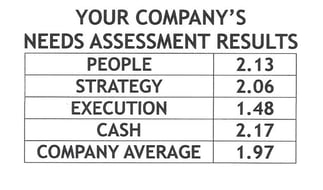
“First Who than What” Jim Collins, Good to Great.
The most important resource in your organization is your People.
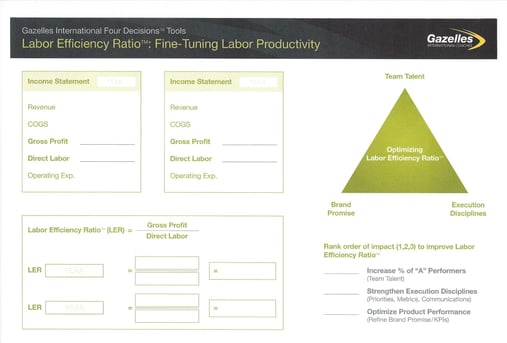
Greg Crabtree, author of Simple Numbers Straight Talk Big Profits, developed a Cash Decision tool, the Labor Efficiency Ratio. It’s one of Positioning Systems CASH DECISION TOOLS to help our customers. Watch the video.
LER has multiple uses. It is an easy concept to understand and calculate.
Here are several benefits LER can help you learn about your people and your business:
- Is your Direct Labor force working too hard?
- Is your Direct Labor force underutilized?
- Which members of your team are the most efficient?
- Which team member is not working efficiently?
- What are the trends in your labor productivity?
- Is your management team getting the most out of your labor force?
- Which customers are most productive for your business?
- Which project or segment of your business is most productive/profitable?
- Establish a productivity ratio for your direct labor force you can measure and use in the Job Summary Scorecard for Accountabilities
- Create what-if scenarios: Example - How much will we have to increase contribution margin, net profit, Gross margin, and ultimately, how much revenue by adding a salesperson?
TWO LER’S
Doing LER once is valuable. Reviewing historical data on your Labor Efficiency Ratio is more valuable. Look at historical Direct Labor Efficiency Ratio and Management Labor Efficiency Ratios compared against your profit. A good place to start is with the last 4 quarters.
You must separate Labor Pools into two segments (@1:58 on Video). Most accounting practices and income statements do not show this level of detail.
- Administration/Management Labor (MLER) – Everyone in your organization drives the business. Management, sales, hiring (HR), ordering materials, and overhead costs. Managing They’re also responsible for overseeing the second half.
- Direct Labor (DLER) – Employees responsible for creating the product or service you sell. These are the tactical staff responsible for creating the value of your product or services.
Use the 50% Rule to determine which labor pool your people belong in. If 50% of their time is spent creating your product or service place them in DLER
- The formula for DLER is Gross Margin (Revenue – Cost of Goods) / Direct Labor
- MLER is Contribution Margin / Admin/Management Labor.
EXAMPLES The video shares two examples of companies, Widget Manufacturing (starts @ 4:20 in the video) and Nickel & Dime Accounting.
Don’t worry about comparing your LER within your industry or other industries. DLER is focused on how much every dollar of your direct labor force gets you in Gross Margin. In the example, Widget Mfg. has $10 M in revenue. The cost of goods is $5.6 M leaving $4.4 M in Gross Margin. Direct Labor is $1.6 M, leaving $2.8 M in Contribution Margin. DLER is the Gross Margin divided by Direct Labor. The direct labor ratio (DLER) for Widget Mfg. is 2.75.
Think of your Direct Labor Efficiency Ratio like this: For every dollar you invest in Direct Labor, it should produce 2.75X in revenue.
When you review historical data, you’re going to see trends. When DLER is too low it usually means, you’re losing money. You need to either get more work for your team, make changes to your team, or you may need to figure out how to reduce costs.
When DLER is too high, it means you’re overworking your team. Rob Simon, the narrator in the video explains, “It’s like when the car engine light goes on in your vehicle, you’re red lining.”
One of my customers discovered this last year. When your people work too hard, often they leave. It’s more difficult to find top candidates (news of your work culture travels quickly in industry circles). You need to reduce workload to retain your people, which often means hiring new team members.
MLER (explained on the video @ 6:38) is the contribution margin divided by your administration and management labor(facilities, marketing, Admin/Mgmt. Labor, and other expenses). The number is generally higher than your DLER.
WHAT TO DO WITH THE NUMBERS
Once you have the data, look at historical data (8:25). What trends do you see comparing DLER, and MLER against net profit? Trends and nuances will show up over time. The Question is; What’s your story?
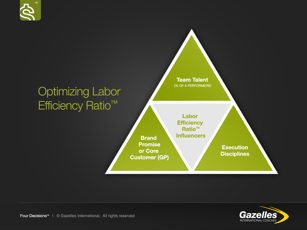
 Filter what you discover through the LER Triangle (10:40):
- People: Do you have the right people on the bus? Do they need training? Is someone on the team disengaged and bringing morale down? Are you understaffed or overstaffed?
- Execution: Are your processes/systems running properly? Does your business need systems for greater consistency in performance? Do you have communication issues? Are you meeting regularly following the Scaling Up and Strategic Discipline meeting rhythms?
- Strategy: Is your Core Customer identified correctly? Do you have customers who appreciate and are willing to pay for your Brand Promise? The right customer will pay a higher price, and increase your LER. Are you doing the right things to improve your LER? (12:10) Widget Mfg. pulled their LER by a shift to discover if there were issues.
IDENTIFYING BOTTLENECKS AND ISSUES – WHAT IF
Is your business seasonal? Nickel & Dime Accounting is in this example. You will be better served to look at your LER in rolling 12 months (13:25). Detailed data can discover individual team members' (15:26) productivity. Furthermore, you can look at LER by customer. Are you losing money on a specific customer as seen in the example (17:40) with Flip Burger? Nickel & Dime also discovered their LER by project type (18:00).
An advanced use of LER is “What If” scenarios. In the video (19:05) Widget Mfg. plans to add a salesperson at $100,000 annual compensation. Using the MLER and DLER you can calculate the impact. What does the business need to add in revenue and contribution margin?
In this example, it’s $350,000 in contribution margin and $1.25 M in revenue. This knowledge powerfully impacts decision-making, who to hire, and whether to hire.
This is just one of the many resources Positioning Systems offers to help you make better decisions to manage CASH Decisions in your business. If you’d like help with this or any of Scaling Up's FOUR DECISIONS, contact dwick@positioningsystems.com.
NEXT BLOG – CASH: OXYGEN FOR YOUR BUSINESS.
Would you like to discover you have more cash flow so you don’t have to live month-to-month or be overly dependent upon outside financing sources? The next blog will look at the Cash Conversion Cycle, a tool to help you find the hidden cash inside your business.


.jpeg?width=150&height=135&name=Hand%20with%20marker%20writing%20the%20question%20Whats%20Next_%20(1).jpeg)

